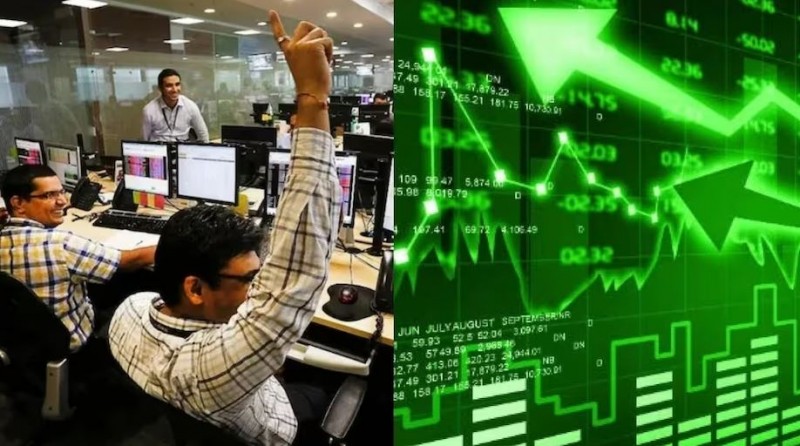
Investing in the share market may be done in a variety of ways; some individuals choose to purchase and hold, while others trade more often. When it comes to the performance of the share market over time, there are also a lot of strange stock indicators and other strange theories. Here’s a look at some of them below.
Some Indicators Worth Noting
It is uncommon for the market to suddenly reverse course and go from the oversold to the overbought zone in a brief period of time. This, along with the fact that more than 50% of equities have demonstrated trend breaks, is quite uncommon in the Indian environment. This implies that a significant market surge may be imminent. The fact that the Breadth Thrust has only been seen seven times and the Breakout Thrust only six times in the past serves as a proxy for the rarity of these signals.
India does not experience as many wide-universe width expansions as the US does. Such signals are rigorous affairs and deserve huge attention after bear trends.
There have only been seven occurrences of what is being referred to as "breadth thrust" in the last 20 years. Six times in a row, the one-year returns after this signal were positive when calculated on Nifty500 stocks. At that level, the average annual returns were 43%. Returns at the stock level were significantly higher.
Even less common is the breakthrough signal. There have only been six instances of it, and in every period, the average returns that followed the signal were positive. The following rates apply 2.14 percent for one week, 7.50 percent for one month, 18.50 percent for three months, 37.50 percent for six months, and 52% for one year.
It is an exceptionally explosive buy signal since it is the first time that the breadth and breakout thrusts occur together. In three previous cases (May 2003, August 2006, and March 2009) in India, the Breakout Thrust followed the Breadth Thrust within a two-month period. It should be observed that the market saw its largest rallies after these three events.
This is the moment to be a price-taker since waiting for your price carries a significant risk: you might miss the start of one of the biggest and longest rallies ever. This is becoming greater since both signals are developing at the same time.
How the Indian Market Panned Out in 2023?
The Indian share market saw a major recovery in 2023 after initially declining, with the Nifty attaining a 18% year-to-date gain. Small—and mid-cap equities did better, returning 50% and 40%, respectively. The market saw the introduction of 57 mainboard initial public offerings (IPOs). While new-age industries showed a mixed picture, several sectors, such as defense, real estate, cars, PSEs, and pharmaceuticals, stood out as notable achievers.
The year was also notable for bringing value stocks back into the mainstream after a long absence. Value stocks underwent widespread changes in 2023 that had not been witnessed in the previous few decades. With the SIP book smashing all records and recording the highest-ever monthly flow of ₹17,000 crores, the domestic funds and HNIs deserve the most of the credit for this rally.
Japan's Nikkei Leads Asian Market Decline, Global Stock Sell-Off Deepens
Tata Group's New Semiconductor Unit in Assam to Create 26,000 Jobs, Boost India's Tech Industry
Jobs Alert: IBPS PO 2024 Regn Begins for 4455 Posts Today at ibps.in - Here's How to Apply